Real Time Charting of PostgreSQL Database
SqlDashboards is longer actively being maintained. It is in limited maintenance mode for existing customers only.
Pulse is the replacement. Pulse allows building interactive data tools fast.
In this demo we will create one table in PostgreSQL and display the data in sqlDashboards. It's intended only as simple proof of how sqlDashboards works with PostgreSQL, we advise viewing our other examples to see the full range of features offered.
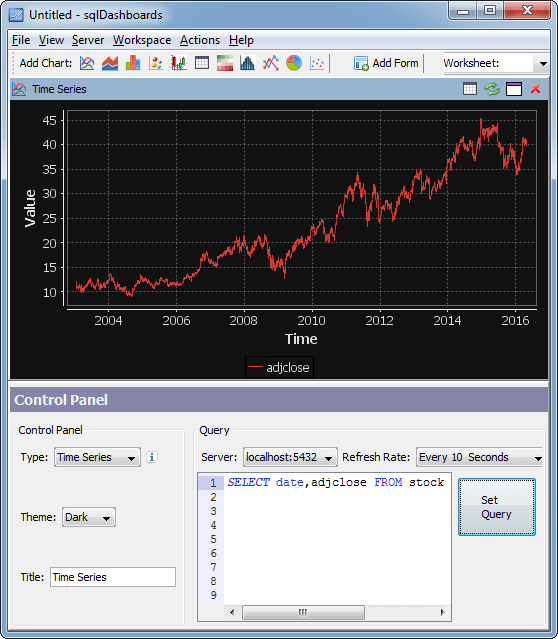
Real-Time PostgreSQL Database Charts
Creating our PostgreSQL Stock Database
For this demo we are going to use oracle stock price as our data source. You can download the full SQL. Which includes steps for creating our database:
Next we insert our data. e.g.
Creating our PostgreSQL Chart
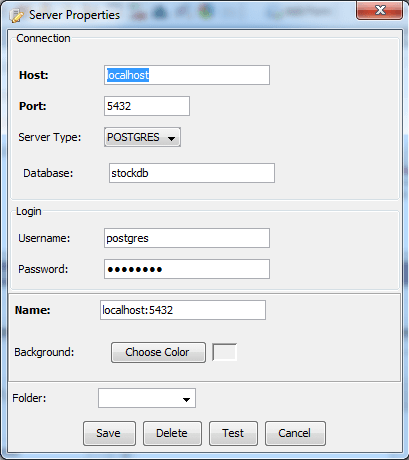
First add our PostgreSQL server
Then add a time-series chart and we are done.