SqlDashboards is longer actively being maintained. It is in limited maintenance mode for existing customers only.
Pulse is the replacement. Pulse allows building interactive data tools fast.
sqlDashboards was originally released in 2013 and successfully helped many users create and share desktop dashboards for many years. HTML5, react and modern charting frameworks now allow building a much better solution. Pulse is that solution and provides a lot more functionality than sqlDashboards. We take this opportunity to thank our users for all their contributions over the years and we hope you will join us using Pulse.
sqlDashboards
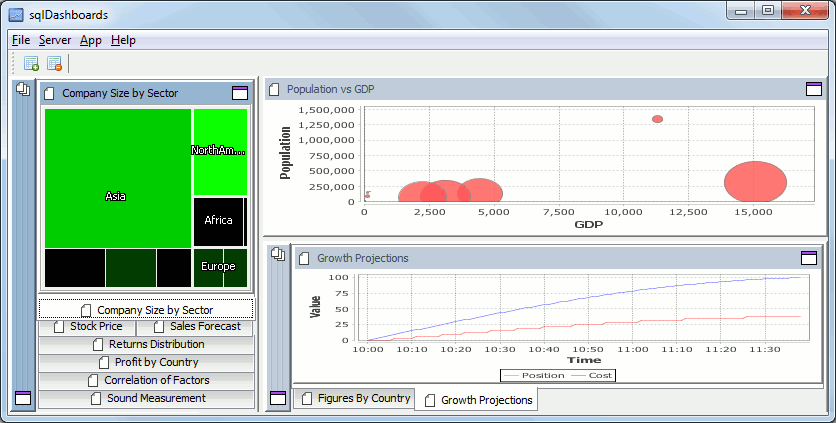
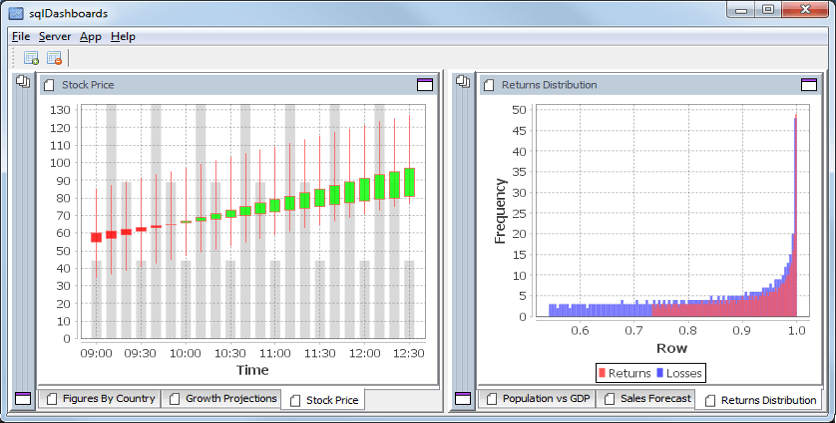
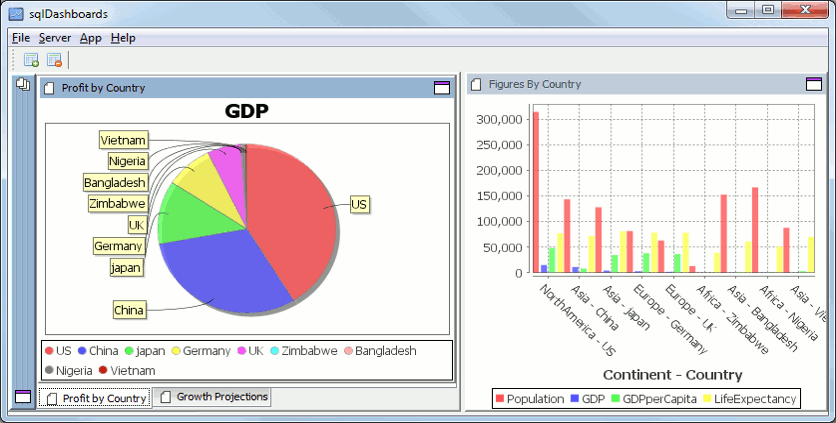
SQL charts for your Database - Display real-time results of database queries in beautiful charts, heatmaps, graphs..
Easiest SQL Chart Tool Possible
To create a chart:
- Add your server Connection
- Enter your Query
- Choose your Chart Type
Once you can create one, simply add more then drag windows around to position and size as desired, it could not be simpler.
Features
- Export charts as .png / .pdf
- Save entire dashboard and send to a friend
- Export entire dashboard as .png / .pdf
Additional features and drivers are being added, if you have any suggestions feel free to contact us.
Available Charts


